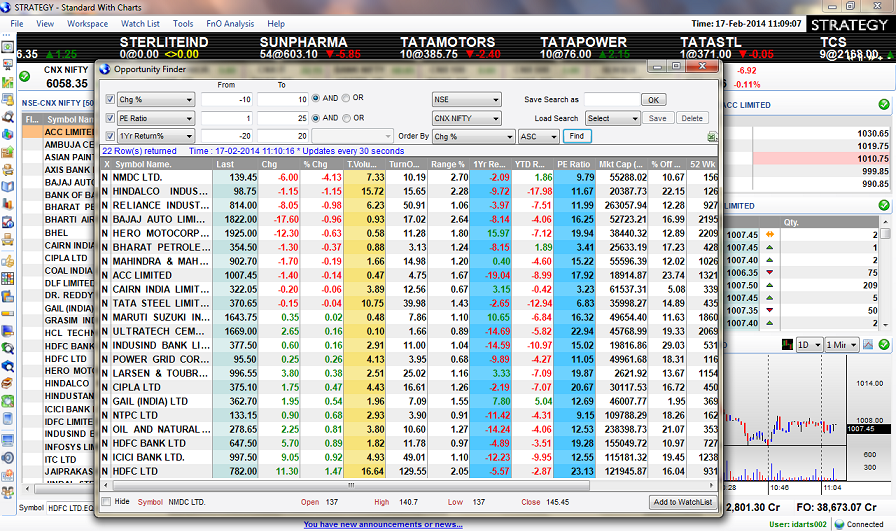
DARTSTOCK is a Market analytics application that integrates most of what traders need into a single platform in the most efficient manner. It helps traders track Market Movements, analyze Information and find stock specific opportunities without having to rely on time consuming searches on different sites.
It is said that for traders, information when delivered accurately on time is money. DARTSTOCK takes it a step further by turning information into Insight and crunching the time taken to zero in on opportunities.
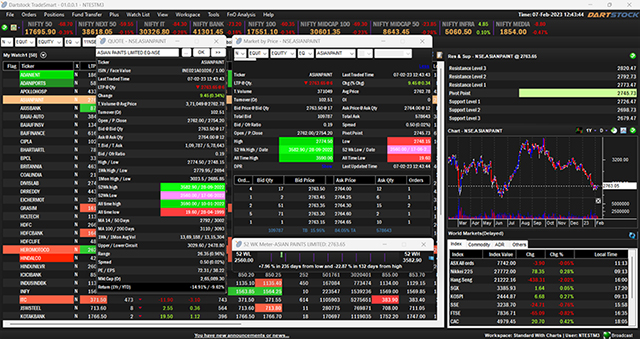
Comprehensive Market Data
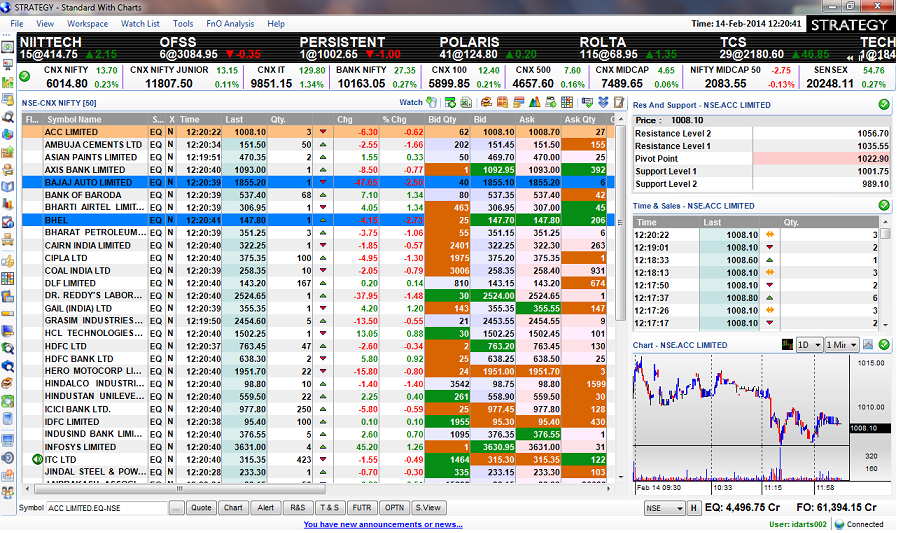
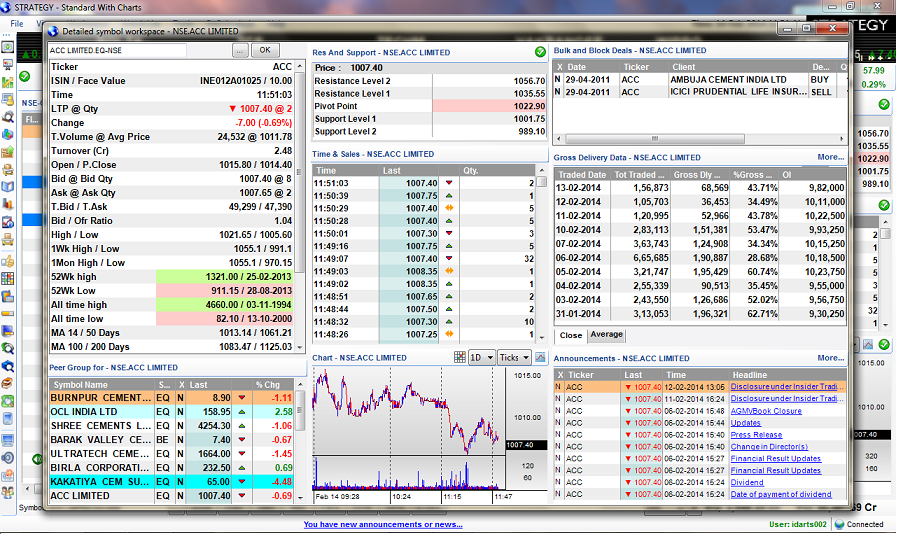
Dartstock provides comprehensive Market Data including Live, historical and derived data. Near-time Market Turnover, Moving averages, Pivot, Resistance & Support Levels, Market Breadth, Returns and various other data is made available for analysis.
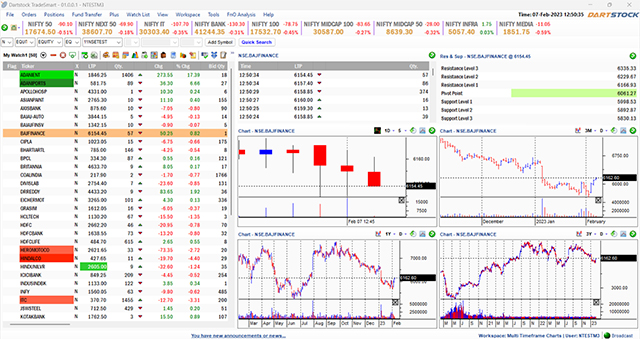
Customizable Workspaces
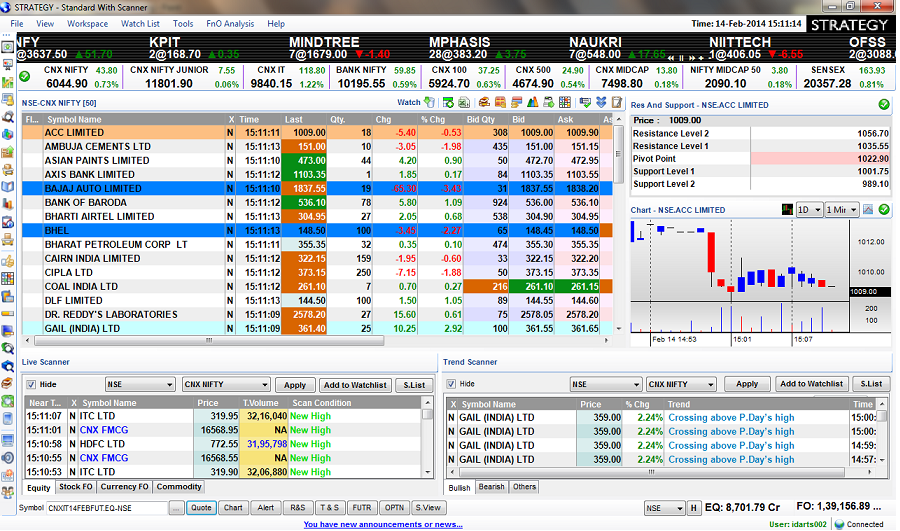
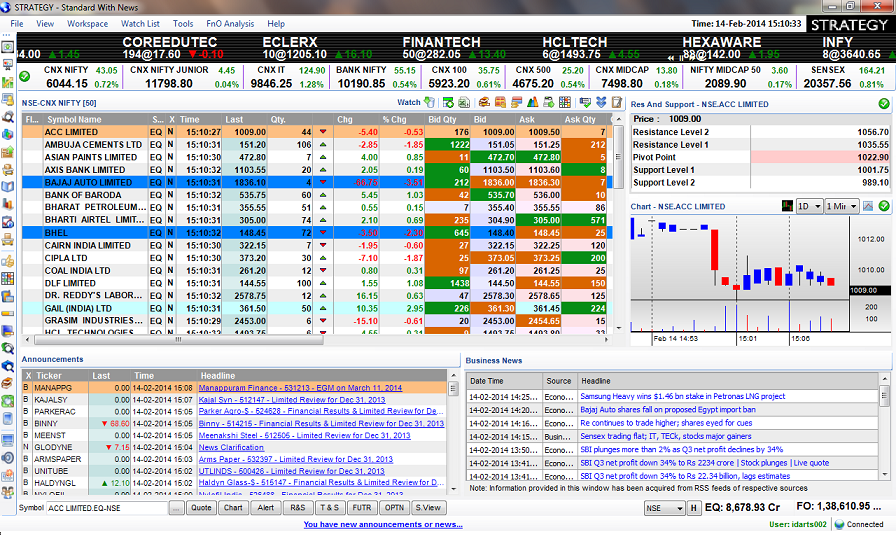
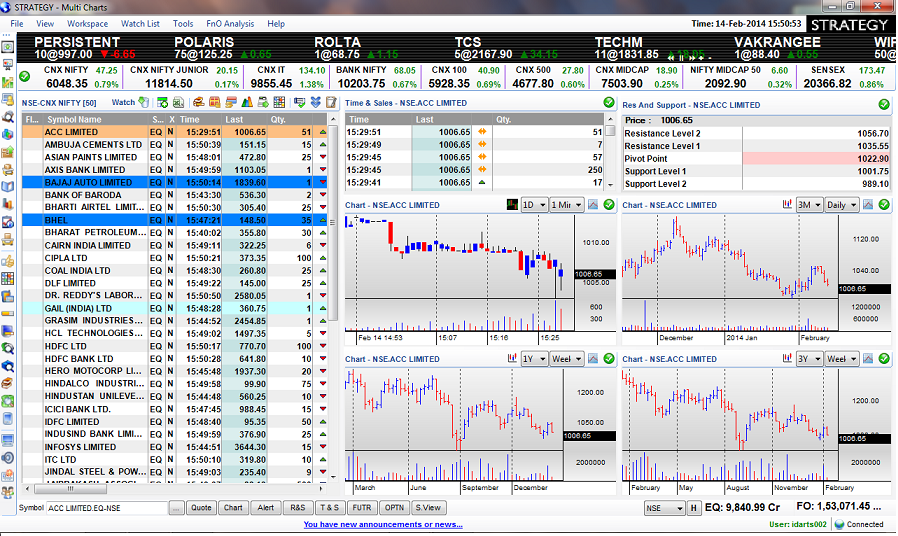
Dartstock comes pre-configured with various workspaces (Dashboards) providing users with a wide choice. In addition, users can create their own workspaces by combining different information windows. These workspaces can be popped out giving flexibility of viewing more than one workspace at the same time.
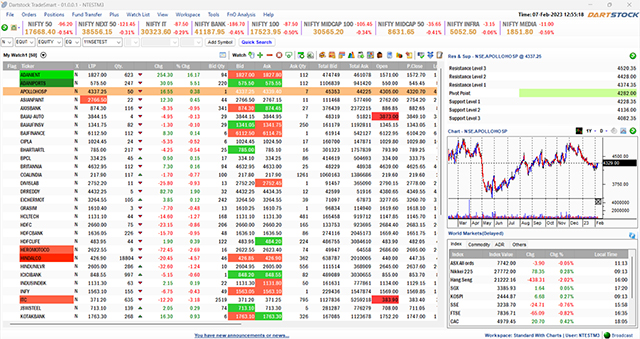
Detailed Market Watch
Dartstock supports multiple pre-defined and user created Watchlist. Pre-defined watch lists are ready to use and are grouped by Index, Sectors, ETF’s, and Futures. A powerful search and filter function reduces dramatically the time users take to locate and add a scrip to their watchlist. Users can set circuit filters and link their Watchlist to Microsoft XL.
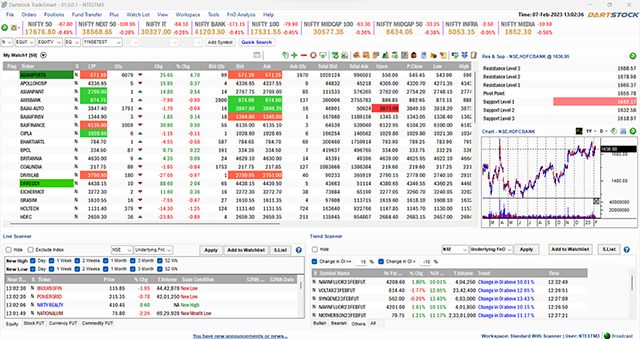
Powerful Scanners
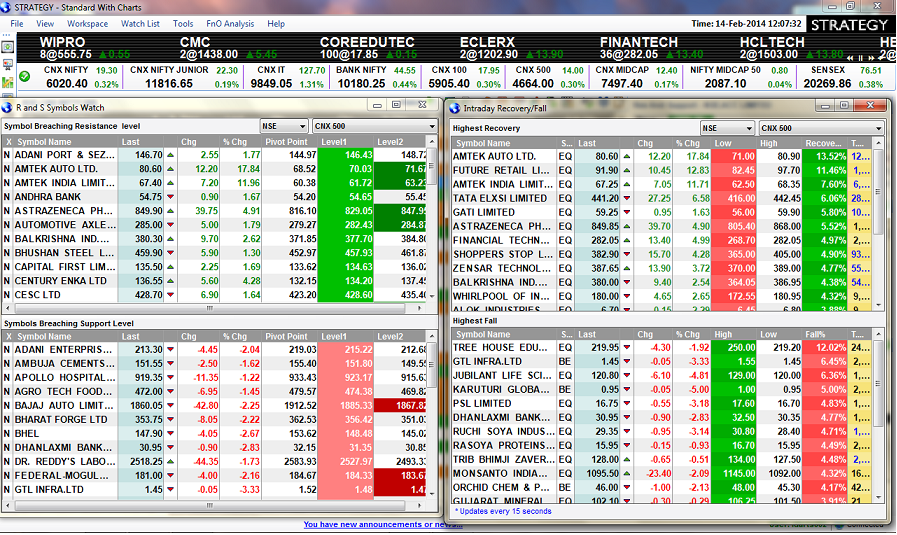
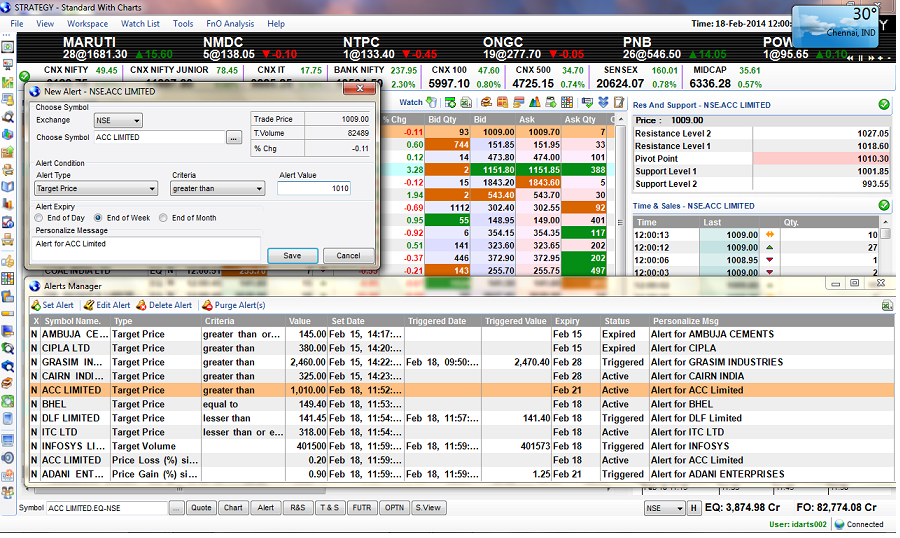
Dartstock includes various scanners that scan the Market live for scrips that are breaching key levels and catch big ticket trades. These scanners can be filtered by a pre-defined or user created watch list. Users can set any number of scrip specific alerts and view them all centrally under Alert Manager.
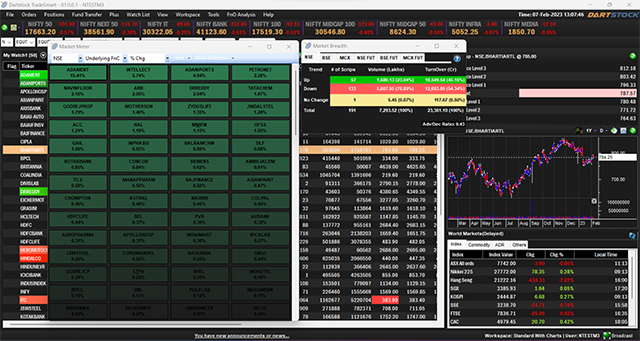
Data Visualization Tools
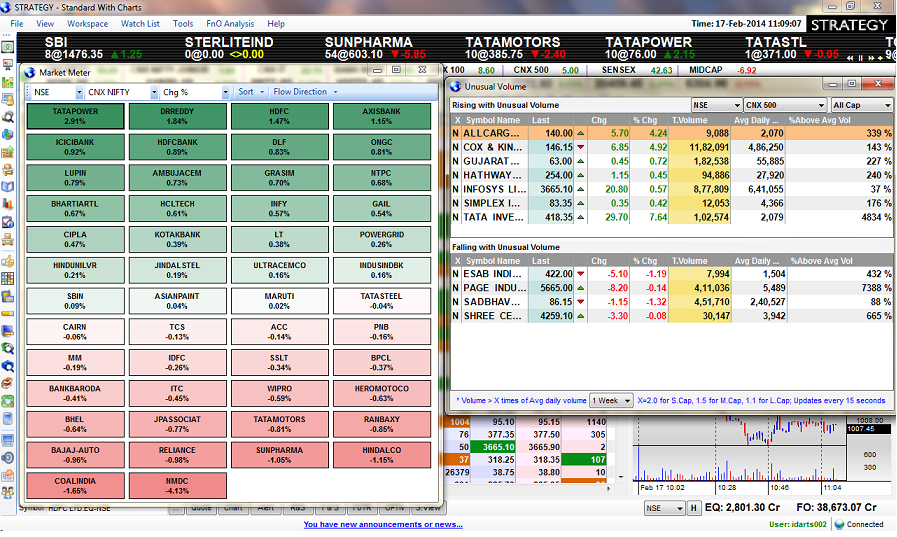
Dartstock Data visualization tools help users get a good overview of the Market. They provide a graphical and color coded representation of data based on various criteria. Heat Map, Symbol Meter, Market Dynamics etc. are some of the tools.
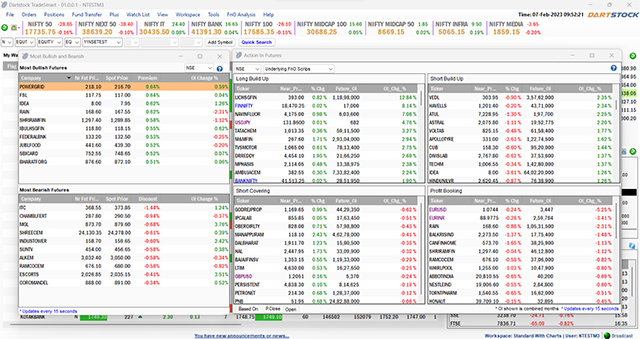
FnO Analysis
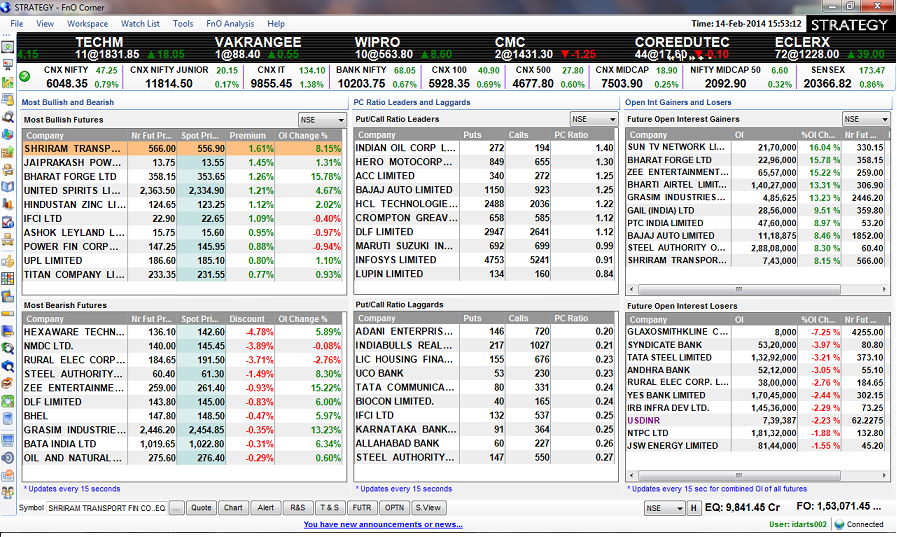
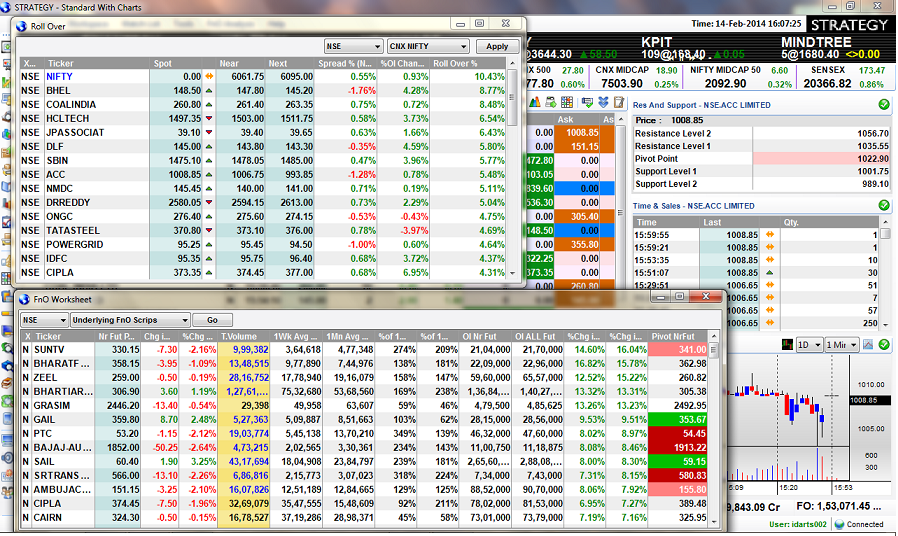
Traders can use tools and data specifically meant for FnO trading. Live Rollover, spreads between cash and Futures, Option chain, Option calculator, OI Gainers & losers, PC leaders and laggards etc. are few of them. Option variance and graphical representation of OI across strike price are very popular.
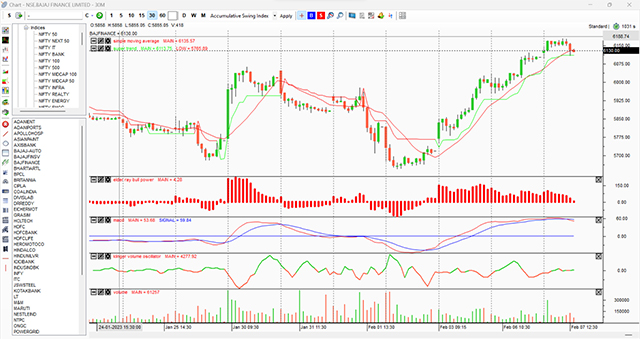
Advanced Charting & Technical analysis
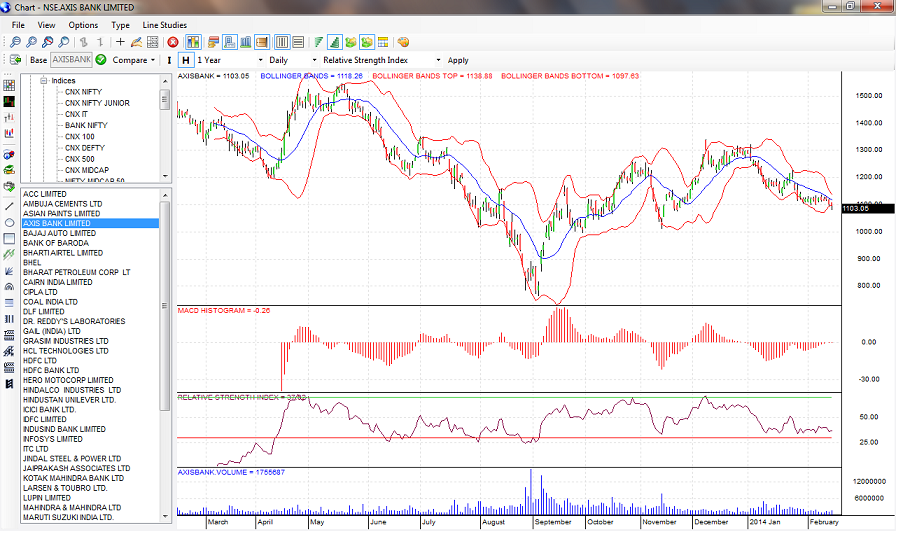
Dartstock Charting tool supports many advanced features and indicators for performing in-depth technical analysis. Four chart types, over 50 indicators, 10 line studies are few of them. Chart data aggregation, comparisons, chart templates etc. are some of other features used by chartists.
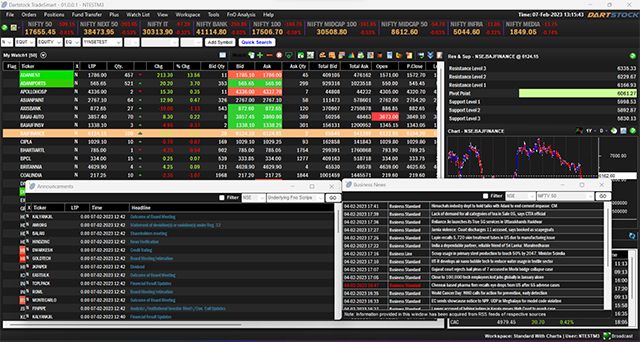
Extensive Reports
Dartstock Publishes over 25 End of day reports to help users understand which scrips witnessed significant movement based on various criteria. News from various sources, announcements and valuable data like Gross delivery, Bulk Block deals are all served at the click of a button.

